
The question content
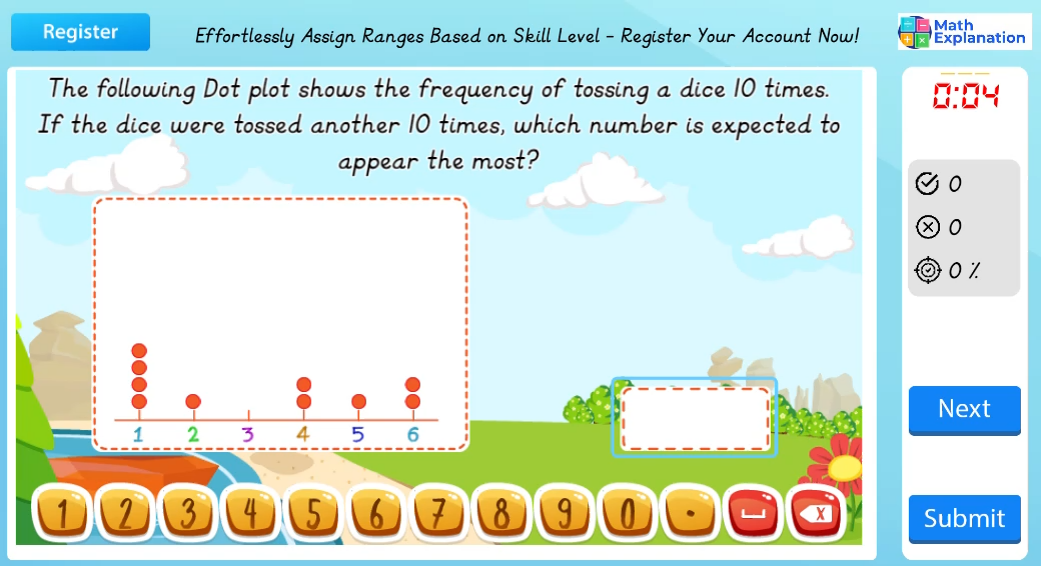
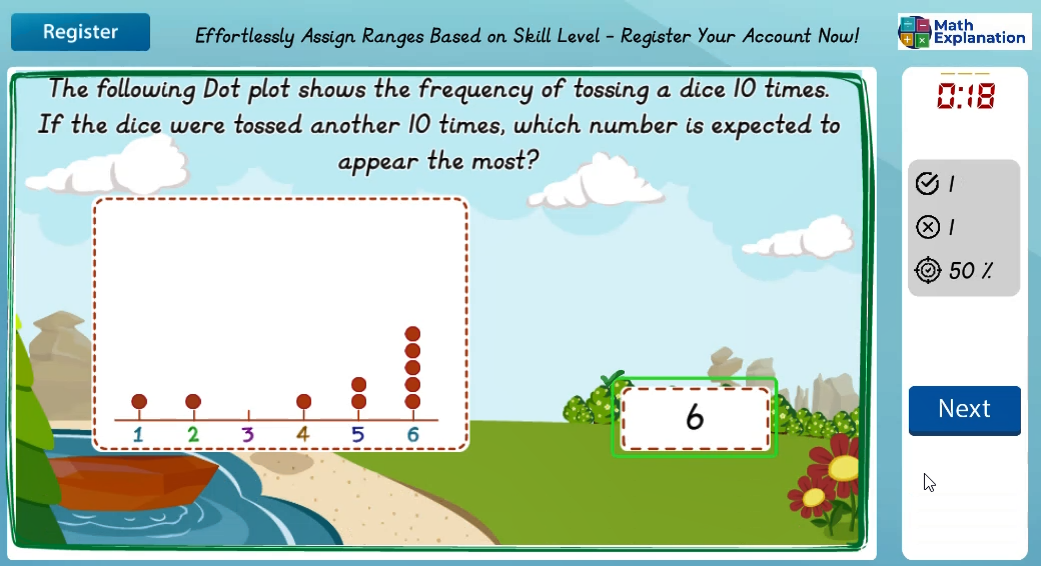
The following Dot plot shows the frequency of tossing a
dice 10 times.
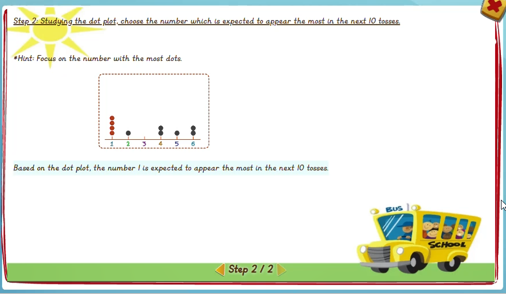
If the dice were tossed another 10
times, which number is expected to appear the most?
Then answer and click the Submit button to send the answer and view the results.
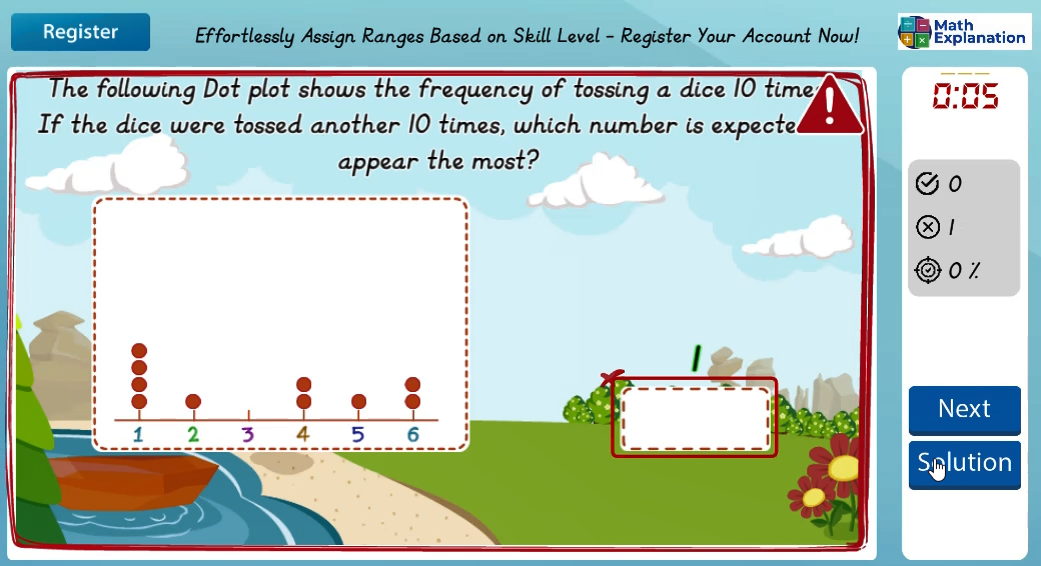
View the answer result
Then click the
Solution
To view instructions on how to answer correctly.
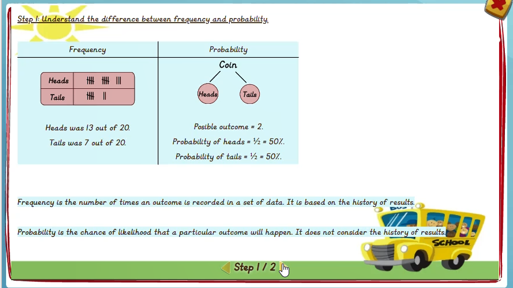
Check the correct result
and then press the
Next
to continue answering the next question.
All questions are generated with a specific difficulty level tailored for you
Practice NowThe platform teaches different methods and techniques to solve problems and offers detailed explanations for each step. It also allows students to check their answers, see examples, and learn tips and tricks to improve their math skills.
Register FreeAustralia's Most Engaging Primary Maths Software.